Preventing churn in the telecommunications industry
Data set
Usually, in churn prevention cases, the number of clients who leave your company (positives) is much lower than those who remain your customers (negatives). Unfortunately, this means the data is not well-balanced, which can complicate data analysis and cause the predictive model to predict negative results consistently.
Given the complex nature of customer churn, we can assume that there is not just a single variable with a very high logistic correlation to our target.
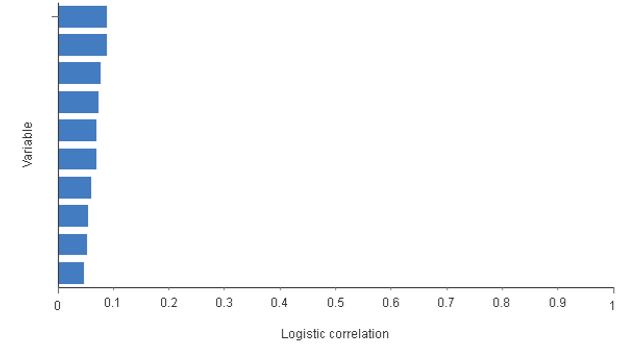
As you can see from the graph above, none of the variables has more than 10% influence on churn decisions.
Data analysis
Our team studied different possibilities for this project. Still, the one that worked best was building our own predictive model and decreasing the adverse effect of poorly balanced data sets on most models. Those models indicated a lot of precision and specificity; however, as it is not a balanced data set, they are not good indicators. Also, the sensitivity of models that do not account for unbalanced data sets can be really poor.
On the other hand, Artelnics’ predictive model uses a self-developed algorithm that minimizes the weighted quadratic error. Using it, the problems associated with poorly balanced data sets are solved, as in this case.
| Classification test | |
|---|---|
| Precision | 67.80% |
| Error | 32.20% |
| Sensitivity | 74.47% |
| Specificity | 67.59% |
From this graph, you can see that our model has relatively low precision, meaning some clients our model predicts will churn, but in reality, they do not. However, knowing that the sensitivity is 75%, low precision might indicate that the model predicts high-risk customers who do not abandon the company.
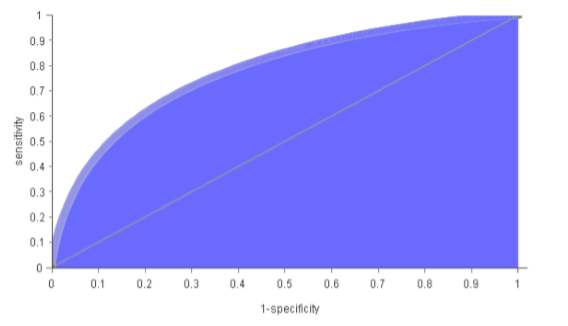
The quality of the model can also be measured by calculating the area under the ROC curve. In this case, the area is 0.78, which indicates good performance.
Conclusions
Using our artificial intelligence technology in the telecom sector offers numerous benefits for companies, such as churn prevention and customer targeting. With Artelnics technology, our customers can predict high-risk clients, creating more opportunities to prevent churn and continue developing benefits for the company.
As expressed before, stopping churn is crucial because it incurs direct and indirect costs and denies any future income potential from that customer.