Data set
In this project, we used the Spanish National Hospital Discharge Database (period 2003-2013) to select all hospital admissions of major LEA procedures in T2DM patients.
The data file analyzed included all procedures of major amputation, defined as any LEA through or proximal to the ankle joint. The final sample included 40,857 patients who had undergone major amputation procedures between January 1, 2003, and December 31, 2013.
Data analysis
Our team elaborated different neural network models to analyze which one offered the best results. The two models that offered the best result were:
- All comordibities included in the Charlson comordibities index (CCI).
- All comordibities included in the Elixhauser comordibities index (ECI).
Both models used a standard feed-forward, back-propagation neural network, each with its inputs, trained using the quasi-Newton training algorithm and optimized using model selection algorithms.
To comparate the models, a comparison of performance in terms of binary classification tests were made:
| Indices | Description | Charlson | Elixhauser |
|---|---|---|---|
| Accuracy rate | Ratio of instances correctly classified | 0.830 | 0.861 |
| Error rate | Ratio of instances misclassified | 0.169 | 0.138 |
| Sensitivity | Portion of actual positives which are predicted positive | 0.744 | 0.763 |
| Specifity | Portion of actual negative predicted negative | 0.912 | 0.960 |
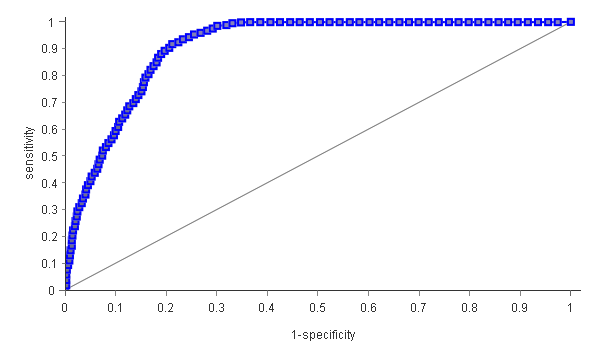
To have a better knowledge about which model to use, we studied the ROC curves.

The ECI model (that you can see above) showed a better area under the ROC curve 91.7% compared with the CCI model (91.7% [95% CI 90.3–93.0] vs 88.9% [95% CI; 87.5–90.2]), which means that it will correctly predict more cases.
After knowing that the CCI offered better results, Artelnics studied the different variable sensitive ratios (VSR) to know which variables are the best predictors for IHM following major ELA.
| Variable ranking | CCI variables | Variable sensitive ratios |
|---|---|---|
| 1st | Age | 1.577 |
| 2nd | Female | 1.559 |
| 3rd | Myocardial infarction | 1.477 |
| 4th | Renal disease | 1.456 |
| 5th | Congestive heart failure | 1.447 |
| 6th | Moderate or severe liver disease | 1.412 |
| 7th | Metastatic solid tumor | 1.362 |
Neural Network
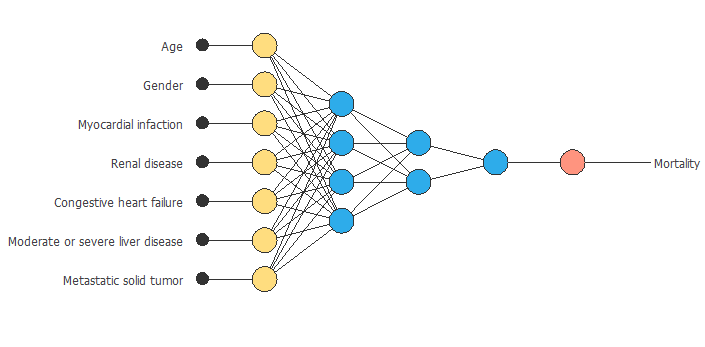
Now that we have determined that the model to use is the Charlson comorbidity index, we can design a neural network able to predict in-hospital mortality in the studied cases. The inputs of the neural network corresponding to the different variables the CCI considers. Then, the two hidden layers will make the necessary calculations to predict the output, mortality.

Conclusions
With our work, we compared the two most commonly used comorbidity risk adjustment models, CCI and ECI, to determine which one adjusts better to type 2 diabetes mortality following major lower extremity amputation, underlying that some of the patient conditions make them more likely than others to have more health complications.
It can be seen from the study that the Charlson comorbidity offers slightly better results than can result in fewer errors.
IHM after major LEA in type 2 diabetes patients ranges from 7% to 12.4%. A further investigation into the motives behind the amputation decision would explain the difference in postoperative mortality rates.
One of the variables that affect the most is age. Older age is associated with a higher prevalence of comorbid conditions, which are also associated with higher IHM rates. It can also be seen that women have higher mortality rates in type 2 diabetes. In this graph, you can see the neural network created with the Charlson comorbidity index variables.
In conclusion, the predictors analyzed in our study could and should be applied in the clinical decision making to reduce mortality risk in type 2 diabetes patients.